
AI & Automation, GIS Insights
Choosing where to build — a substation, a solar site, a warehouse, a telecom tower — is one of the most expensive decisions an infrastructure organisation makes. And it is fundamentally a geospatial question: terrain, proximity, constraints, existing assets, demand patterns.
Yet in most organisations, siting analysis still looks like this:
The bottleneck isn’t the data — it’s the interface between people and spatial data. Non-GIS stakeholders simply cannot ask the map questions directly.
The modern answer combines three ingredients: a fast web-based GIS dashboard, cloud-scale data handling, and the real breakthrough — natural language as the query interface.
Instead of static reports, the entire product is built around an interactive web map (Mapbox GL JS, Leaflet or ArcGIS Maps SDK). Layers, filters, tooltips and overlays let users explore sites visually with the map, not a table, as the primary interface.
Infrastructure datasets are big: parcels, networks, terrain, imagery-derived features. Techniques like vector tiling, clustering and lazy loading keep the map fast even with hundreds of thousands of features, while cloud storage (Azure Blob / Data Lake or equivalent) handles the volume behind the scenes.
This is the feature that changes who can use GIS. A user types:
“Show me all candidate sites within 2 km of the grid, outside flood zones.”
An LLM-driven agent interprets the request, converts it into a spatial query, and the map updates instantly — filtered, zoomed, highlighted. No GIS training required.
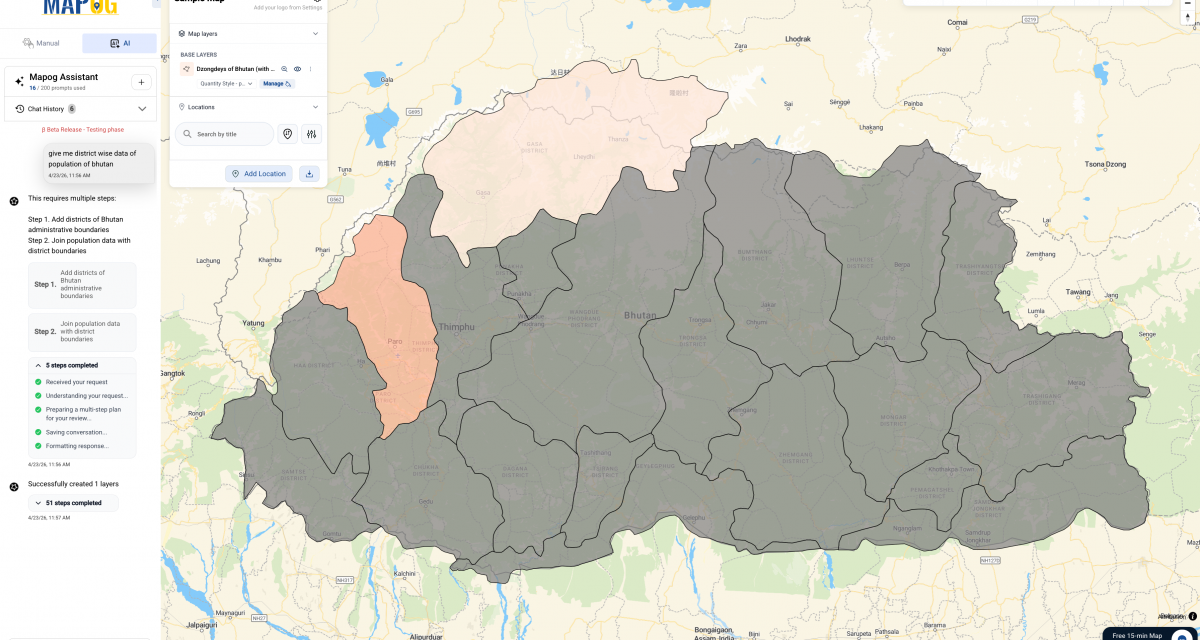
We know this pattern works because we’ve built it: on mapog.com, users describe what they want in plain text and our AI chatbot generates the features directly on the map. Watching a non-technical user “talk” to a map for the first time is the moment you realise this is the future interface of GIS.
Beyond queries, the AI layer can generate recommendations: scoring candidate sites, summarising trade-offs, and explaining why one location outranks another — turning the dashboard from a viewer into an advisor.
The next generation of siting tools won’t ask users to learn GIS. They’ll let users ask the map in their own words and get a spatial answer instantly. Organisations that adopt this GeoAI interface first will simply make location decisions faster than their competitors.
Leave a Reply