
July 27, 2026

From Raw Drone Photos to a Georeferenced Map, Automatically: How We Built MAPOG’s Aerial Mapping Platform

AI & Automation, Drone to GIS, GIS Insights, Map Analysis, Spatial Analysis
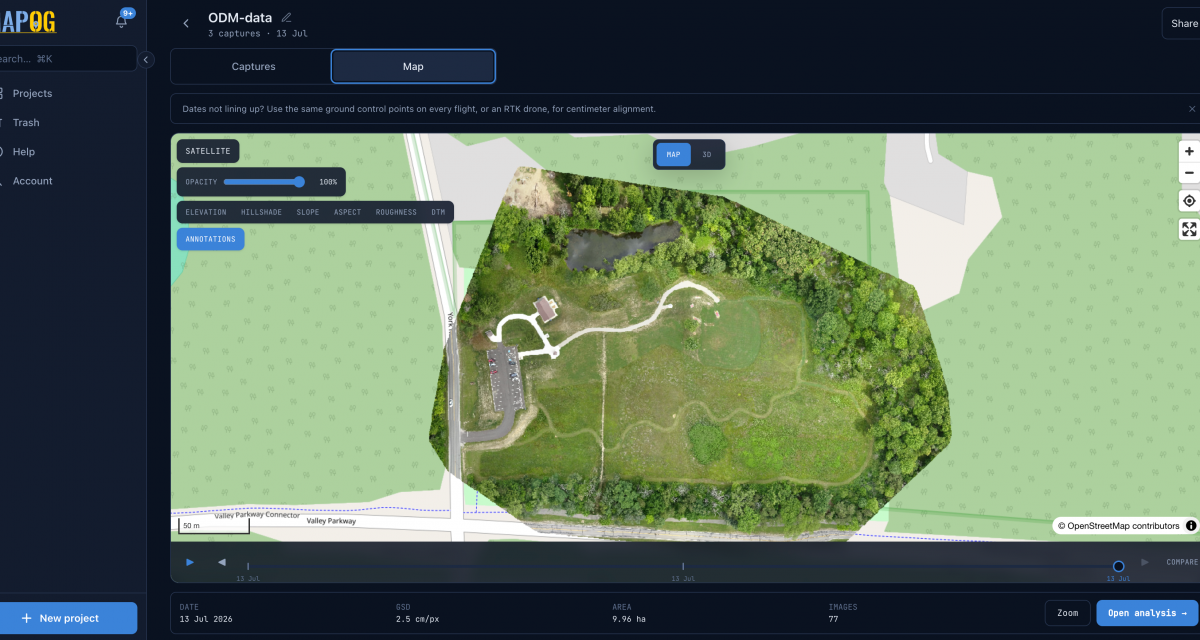
Drone surveys produce hundreds of raw, overlapping photos that are useless until they’re stitched, georeferenced, and turned into maps a professional can measure on. Doing that traditionally means expensive desktop photogrammetry software, a powerful workstation, GIS expertise, and hours of manual work per flight.

We built a web-based drone mapping platform that automates the whole journey. A user uploads a flight, presses one button, and gets back a seamless georeferenced orthomosaic, elevation models (DSM/DTM), a 3D point cloud, a textured 3D mesh, and terrain analytics — viewable on an interactive map and downloadable for GIS use. Processing runs on auto-scaling cloud infrastructure, so no local hardware is required, and the system is engineered to never lose a job even through crashes, restarts, or infrastructure failures.

The Problem

Drones have made aerial data capture cheap and fast. But the data that comes off a drone is not a map — it’s a folder of hundreds of individual JPEGs, each with a slightly different angle and an imprecise GPS tag. Between that raw folder and something a surveyor, engineer, or planner can actually use sits a hard technical problem: photogrammetry.

To turn those photos into a usable deliverable, you have to:

  1. Stitch hundreds of overlapping images into one seamless mosaic.
  2. Georeference it so every pixel sits at real-world coordinates.
  3. Reconstruct 3D — derive elevation surfaces, point clouds, and mesh models from the parallax between photos.
  4. Package it for GIS — as Cloud-Optimized GeoTIFFs, point-cloud formats, and vector exports.

In practice, teams hit the same walls over and over:

  • Heavy, expensive desktop software. Traditional photogrammetry suites require per-seat licenses and lock the work to one machine.
  • Serious hardware requirements. Processing a few hundred images can peg 16–32 GB of RAM for hours. Most laptops can’t do it; a dedicated workstation is a real cost.
  • Specialized expertise. Getting good output means understanding feature-matching quality, point-cloud density, resolution trade-offs, and coordinate systems — knowledge most field teams don’t have.
  • Slow, manual, one-at-a-time workflows. Each flight is babysat by hand. There’s no queue, no progress visibility, and a crash mid-process means starting over.
  • No collaboration. Results live as giant files on someone’s hard drive, awkward to share with a client or a colleague and impossible to view without the right software.
  • No history. Surveying the same site monthly means scattered, disconnected result folders with no easy way to compare change over time.

The core question we set out to answer: How do we let anyone turn a drone flight into professional, georeferenced mapping output — with no desktop software, no workstation, and no photogrammetry PhD — and make it fast, reliable, and shareable?

The Solution

We built MAPOG’s drone mapping platform: a mobile-first web application (installable as a PWA) that acts as a complete orchestration and delivery layer around a best-in-class photogrammetry engine.

The user experience is deliberately simple:

Create a project → upload a flight → press “Start processing” → get a full mapping deliverable.

Everything hard happens invisibly behind that button. Under the hood, the platform manages authentication, uploads, a fair processing queue, live progress, cloud compute that scales on demand, result post-processing, private tile serving, an interactive viewer, analytics, and secure sharing.

Crucially, all the heavy photogrammetry is delegated to OpenDroneMap (NodeODM) — the proven open-source engine — while our platform provides everything around it that turns a raw engine into a dependable product: the web app, the job lifecycle, the auto-scaling infrastructure, the resilience, the analytics, and the collaboration layer.

What the user gets back

From a single flight, the platform produces a complete product set:

Deliverable What it is
Orthomosaic A seamless, georeferenced Cloud-Optimized GeoTIFF (COG) — the core “map”
DSM & DTM Digital Surface and Terrain Models — elevation with and without objects
Point cloud A dense 3D point cloud (LAZ) plus a streaming octree for the web
3D mesh A textured 3D-Tiles model of the site
Terrain layers Slope, aspect, roughness, hillshade, and contours
Reports & exports Branded PDF reports and GeoJSON / CSV / DXF / KML / SHP exports

All of it is viewable directly in the browser on an interactive map and 3D viewer — nothing to install.

Key Capabilities

One-click processing with sensible presets

Users choose a quality preset instead of wrestling with dozens of parameters:

  • Fast — a quick orthophoto for a same-day look.
  • Balanced (default) — high-quality ortho at 3 cm/px.
  • High — maximum detail, including a high-resolution DSM.

An advanced option lets power users override resolution or toggle specific outputs, but nobody has to.

Projects and captures — built for time series

The platform models real-world surveying:

  • Project is a place — one site, revisited over time.
  • Capture is one dated flight of that site, preserved forever and never overwritten.

The map view is temporal: a single map with a date slider whose ticks are spaced by the real gaps between flights. Users can scrub between dates, compare two dates side-by-side with a swipe, and play back a site’s evolution. New flights appear on the timeline automatically, in correct chronological order — even if an older date is uploaded later. This makes month-over-month monitoring — construction progress, mining stockpiles, agriculture, erosion — a first-class workflow instead of a manual chore.

A full analysis & intelligence suite

Beyond the base map, the platform includes professional analysis tools that run right in the browser:

  • Measurement & annotation — distance, area, and slope measured on the 3D surface; cross-section profiles; organized annotation folders; copy annotations across dates; metric/imperial.
  • Terrain analysis — elevation, hillshade, and DTM overlays; automatic contour generation with CAD/GIS export.
  • Volumetrics — cut/fill and stockpile volume calculations with multiple base-plane methods and exportable reports.
  • Change detection — elevation-difference maps and net volume/area statistics between two dates, plus volume-over-time charts.
  • Vegetation & surface indices — RGB and (optionally) multispectral indices with zone classification.
  • Inspection — image-level defect tagging with CSV reporting.
  • CAD/BIM overlays — drape DXF/GeoJSON/KML designs over the site and run surface-to-design conformance.
  • Reporting — branded PDF outputs for annotations, stockpiles, site summaries, and change analysis.

Advanced modules (multispectral, AI object detection, BIM, thermal) are feature-flagged and ship off by default, so the platform stays lean and enables capabilities only where needed.

Secure, view-only sharing and collaboration

Results don’t have to leave the platform as giant files. Owners can:

  • Add teammates as read-only viewers.
  • Publish a secure public link with optional password, expiry, and a download on/off switch — perfect for handing a client an interactive map without giving them an account.

Sharing is enforced entirely on the server (hiding buttons is never the security control), with unguessable tokens, rate-limiting, and near-instant revocation — disable a link and its map tiles stop resolving within a minute.

Enterprise-grade security throughout

  • Short-lived access tokens held in memory; rotating refresh tokens in hardened cookies.
  • Every data query is scoped to the authenticated user — foreign IDs simply return “not found,” so nothing is enumerable.
  • Uploads are validated by extension, magic-byte sniffing, and size caps; stored under server-generated IDs so user filenames never touch storage paths.
  • Internal services (the tile server, object storage, the photogrammetry engine) have no public ports — only the front door is exposed.

Under the Hood — How It Works

(For the technically curious. Skip to “Results” if you just want the outcome.)

An orchestration layer over a proven engine

Rather than reinventing photogrammetry, we treat OpenDroneMap/NodeODM as the compute engine and focus our engineering on everything that makes it usable and reliable at scale: the API, the job lifecycle, storage, progress streaming, the viewer, analytics, and — most importantly — resilience and elastic compute.

The stack

  • Frontend: a React Progressive Web App (Vite), installable to a phone’s home screen, with interactive mapping (MapLibre) and 3D visualization.
  • Backend: a FastAPI application exposing a clean REST API.
  • Workers: Celery workers split across two queues — a heavy queue that drives photogrammetry one job at a time (so it never overwhelms the engine) and a light queue that runs the scheduler and housekeeping so monitoring never gets stuck behind a multi-hour render.
  • Data: PostgreSQL (with PostGIS for all vector/geometry features) for metadata, Redis for the job broker, live progress pub/sub, and distributed locks, and MinIO (S3-compatible) for durable object storage.
  • Tiles: TiTiler serves the result GeoTIFFs as fast map tiles, entirely from private, server-built paths.
  • Edge: Caddy terminates TLS (automatic Let’s Encrypt certificates), serves the app, and proxies the API.

Elastic cloud compute — pay only for what you process

Photogrammetry is bursty: idle most of the time, then it needs a lot of RAM and CPU for a couple of hours. To handle that economically, the platform uses ClusterODM with on-demand autoscaling: when a job starts, it spins up a dedicated cloud processing droplet, runs the job there, and tears the droplet down the moment it finishes — so compute cost tracks actual usage instead of a workstation sitting idle. The processing tier is sized intelligently based on the job’s preset and image count, and a GPU-accelerated processing path is available for heavier workloads.

Engineered to never lose a job

This is where a lot of the hard work went. Long-running cloud jobs fail in messy ways — networks blip, containers restart, droplets get reaped, memory runs out. The platform is built so that none of that loses a completed result:

  • Durable-first results. Each processing droplet uploads its finished output to durable object storage before it’s torn down, so the result survives even if the compute machine is already gone.
  • Crash-safe queue. All job state lives in the database, guarded by a heartbeat-renewed distributed lock. Kill the API and workers mid-job and nothing is lost — on restart, the worker re-attaches to the still-running engine task instead of starting over.
  • Self-healing reconciler. A scheduled watchdog re-queues orphaned jobs, enforces wall-clock timeouts, and recovers stale work automatically.
  • Graceful recovery from partial failures. If a late stage runs out of memory, the system salvages a usable result from the durable copy rather than failing the whole run. Predictable, readable failures replace silent hangs.
  • Live, honest progress. Users watch real-time, staged progress (Queued → Uploading → Processing → Finalizing) streamed to the browser, with queue position and an ETA based on recent runs of the same preset.
  • Operational visibility. An admin job monitor gives operators a cross-user view of every run, its engine logs, and the full lifecycle of its cloud droplet.

The result of all this engineering is a system that behaves like infrastructure, not a demo: it keeps its promises even when the underlying cloud misbehaves.

Results & Outcomes

The platform delivers on the goals we set out with:

  • No desktop software, no workstation. The entire workflow runs in a browser; the heavy lifting happens on cloud compute that appears and disappears on demand.
  • Anyone can run it. A field operator uploads a flight and presses one button — no photogrammetry expertise required.
  • A complete deliverable, not just a picture. Every flight yields an orthomosaic, elevation models, a point cloud, a 3D mesh, terrain layers, and analysis tools — all in professional, GIS-ready formats.
  • Fast and cost-efficient. Jobs process on right-sized cloud machines that shut down immediately after, so there’s no idle hardware cost.
  • Reliable at scale. Crash-safe queuing, self-healing recovery, and durable-first storage mean jobs finish even through restarts and failures.
  • Built for monitoring over time. The temporal timeline and change-detection tools make repeat surveys and progress tracking a native workflow.
  • Easy and safe to share. Secure, server-enforced links let clients and teammates explore results interactively, with instant revocation.

Conclusion

Drones made capturing aerial data effortless. This platform makes using it effortless too — closing the gap between a folder of raw photos and a professional, georeferenced, analyzable map. By pairing a proven open-source photogrammetry engine with a carefully engineered orchestration layer — elastic cloud compute, crash-proof job handling, rich in-browser analytics, and secure collaboration — we turned a slow, expensive, expertise-heavy process into a one-click web workflow that scales.

The outcome is a platform that lets organizations get survey-grade mapping and 3D intelligence from their drone flights without buying software, building a workstation, or hiring a photogrammetry specialist — just upload, click, and map.

Leave a Reply

Your email address will not be published.